I have been exploring archify lately and the results are intriguing. It works as a prompt, backed by Node tooling, and it produces opinionated diagrams shaped by the question you ask rather than a generic box-and-line dump of everything it found. Ask for the network and you get a topology. Ask how a request is handled and you get a sequence. The output is standalone HTML you can explore, switch between dark and light, and export.
The home network
My home network is fully documented as .md files. That was never about diagrams. It was so that an agent has something
to reason over when I ask it to change a firewall rule or add a DNS record:
the documentation is the contract, and a change proposed against it is a
change I can check. Archify is a side effect of that decision. Pointed at
the same files, this is what it came up with.
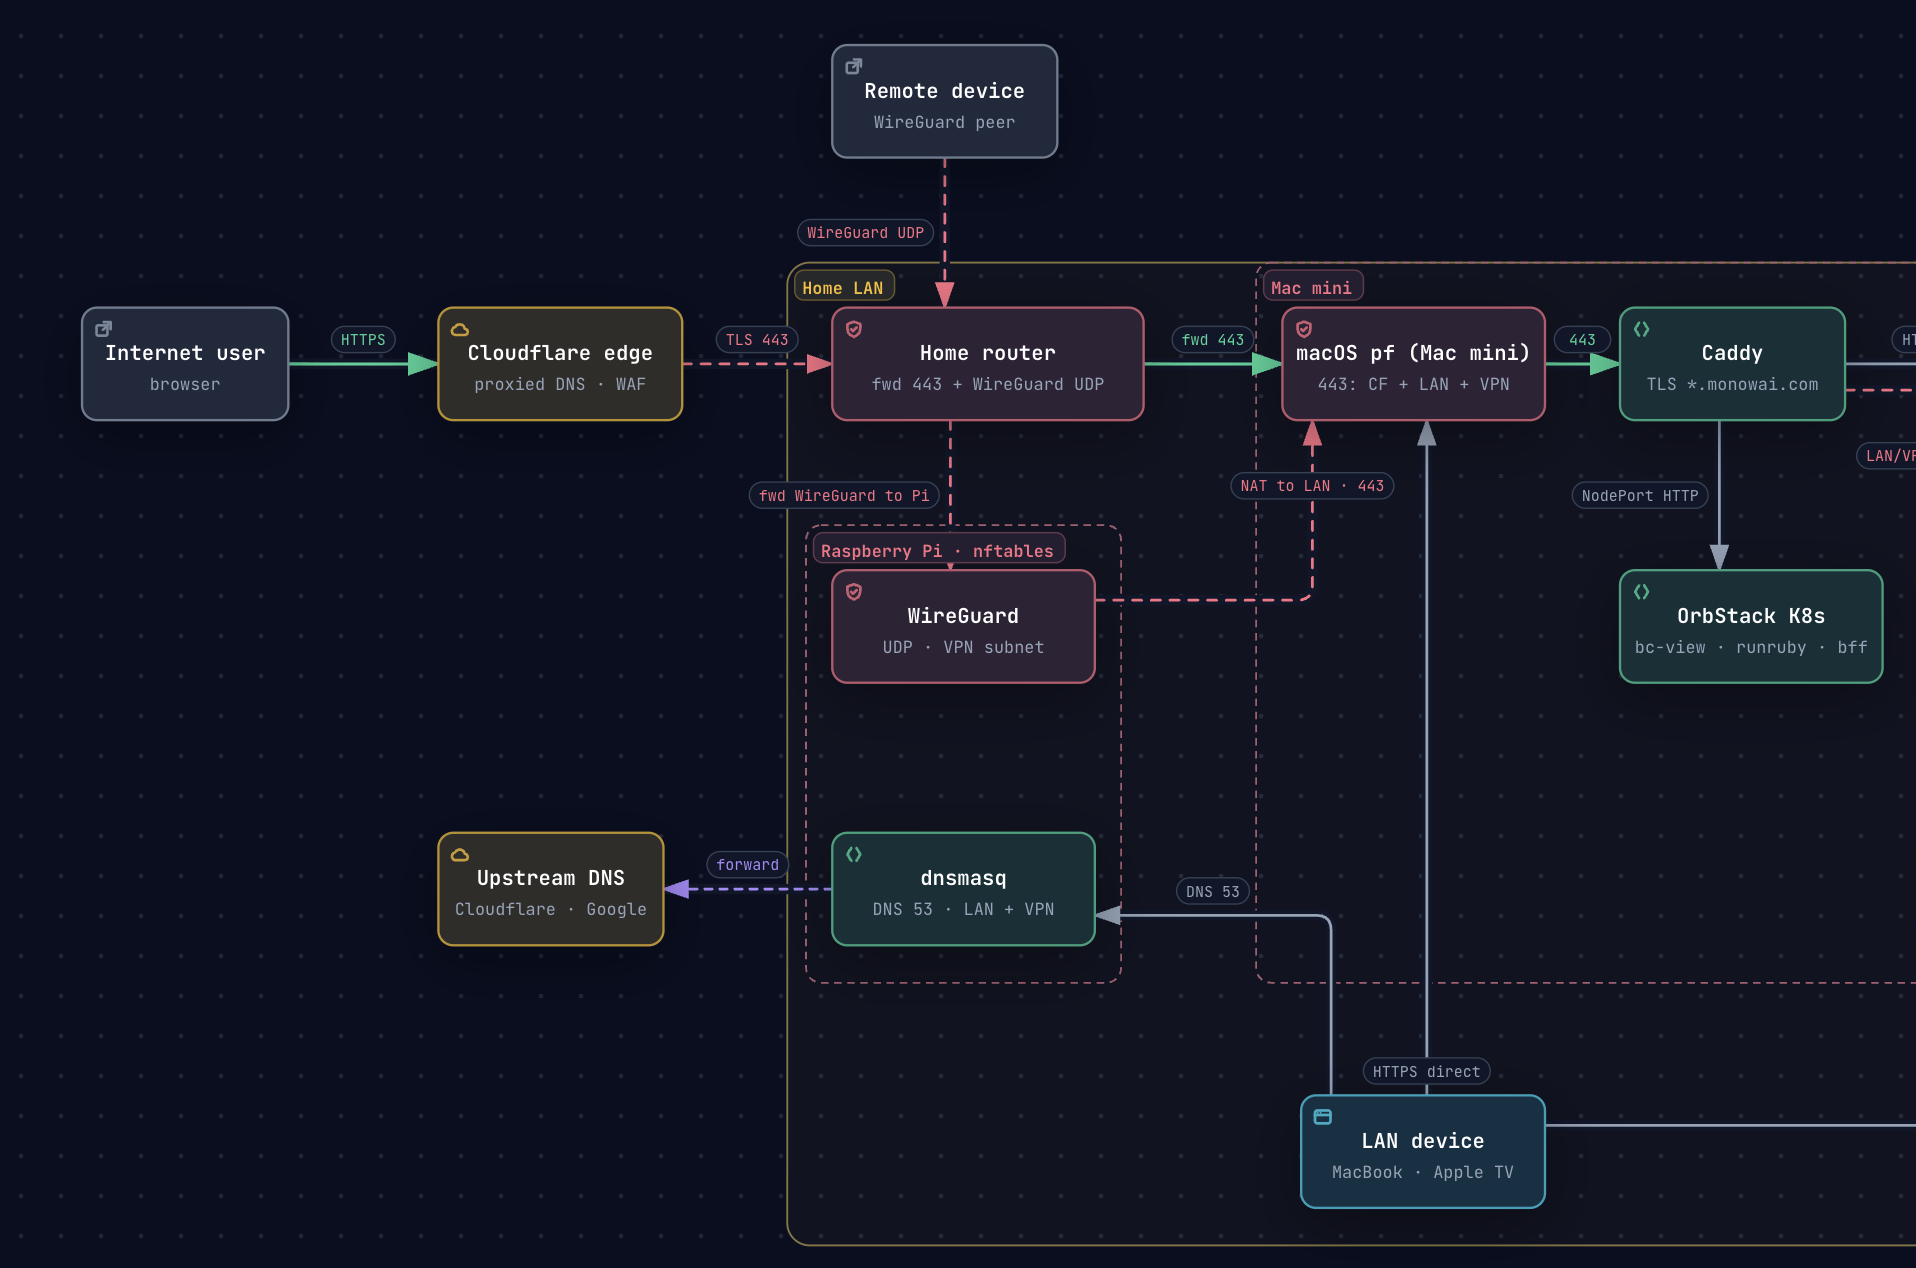
It presents solid-looking output that survives first glance. Look harder and the results can be gappy, and you do need to understand your subject pretty thoroughly to plug those gaps. The first time I asked for this diagram, the remote device went straight to WireGuard without transiting the router. The port forward that makes that path exist was in the documentation; the picture skipped it. Anyone who knows the network sees the hole in a second. Anyone who does not would take the diagram at its word, and the confident finish does the opposite of helping. That is the same property I keep running into with agents generally: plausible is not correct. A diagram with a gap in it looks exactly like a diagram without one.
A codebase it had to find
Beancounter, my personal finance project, is a monorepo with a number of associated repos around it. I asked for a high-level overview and it correctly located the associated repos from the project documentation, without being told where they were, and placed them.
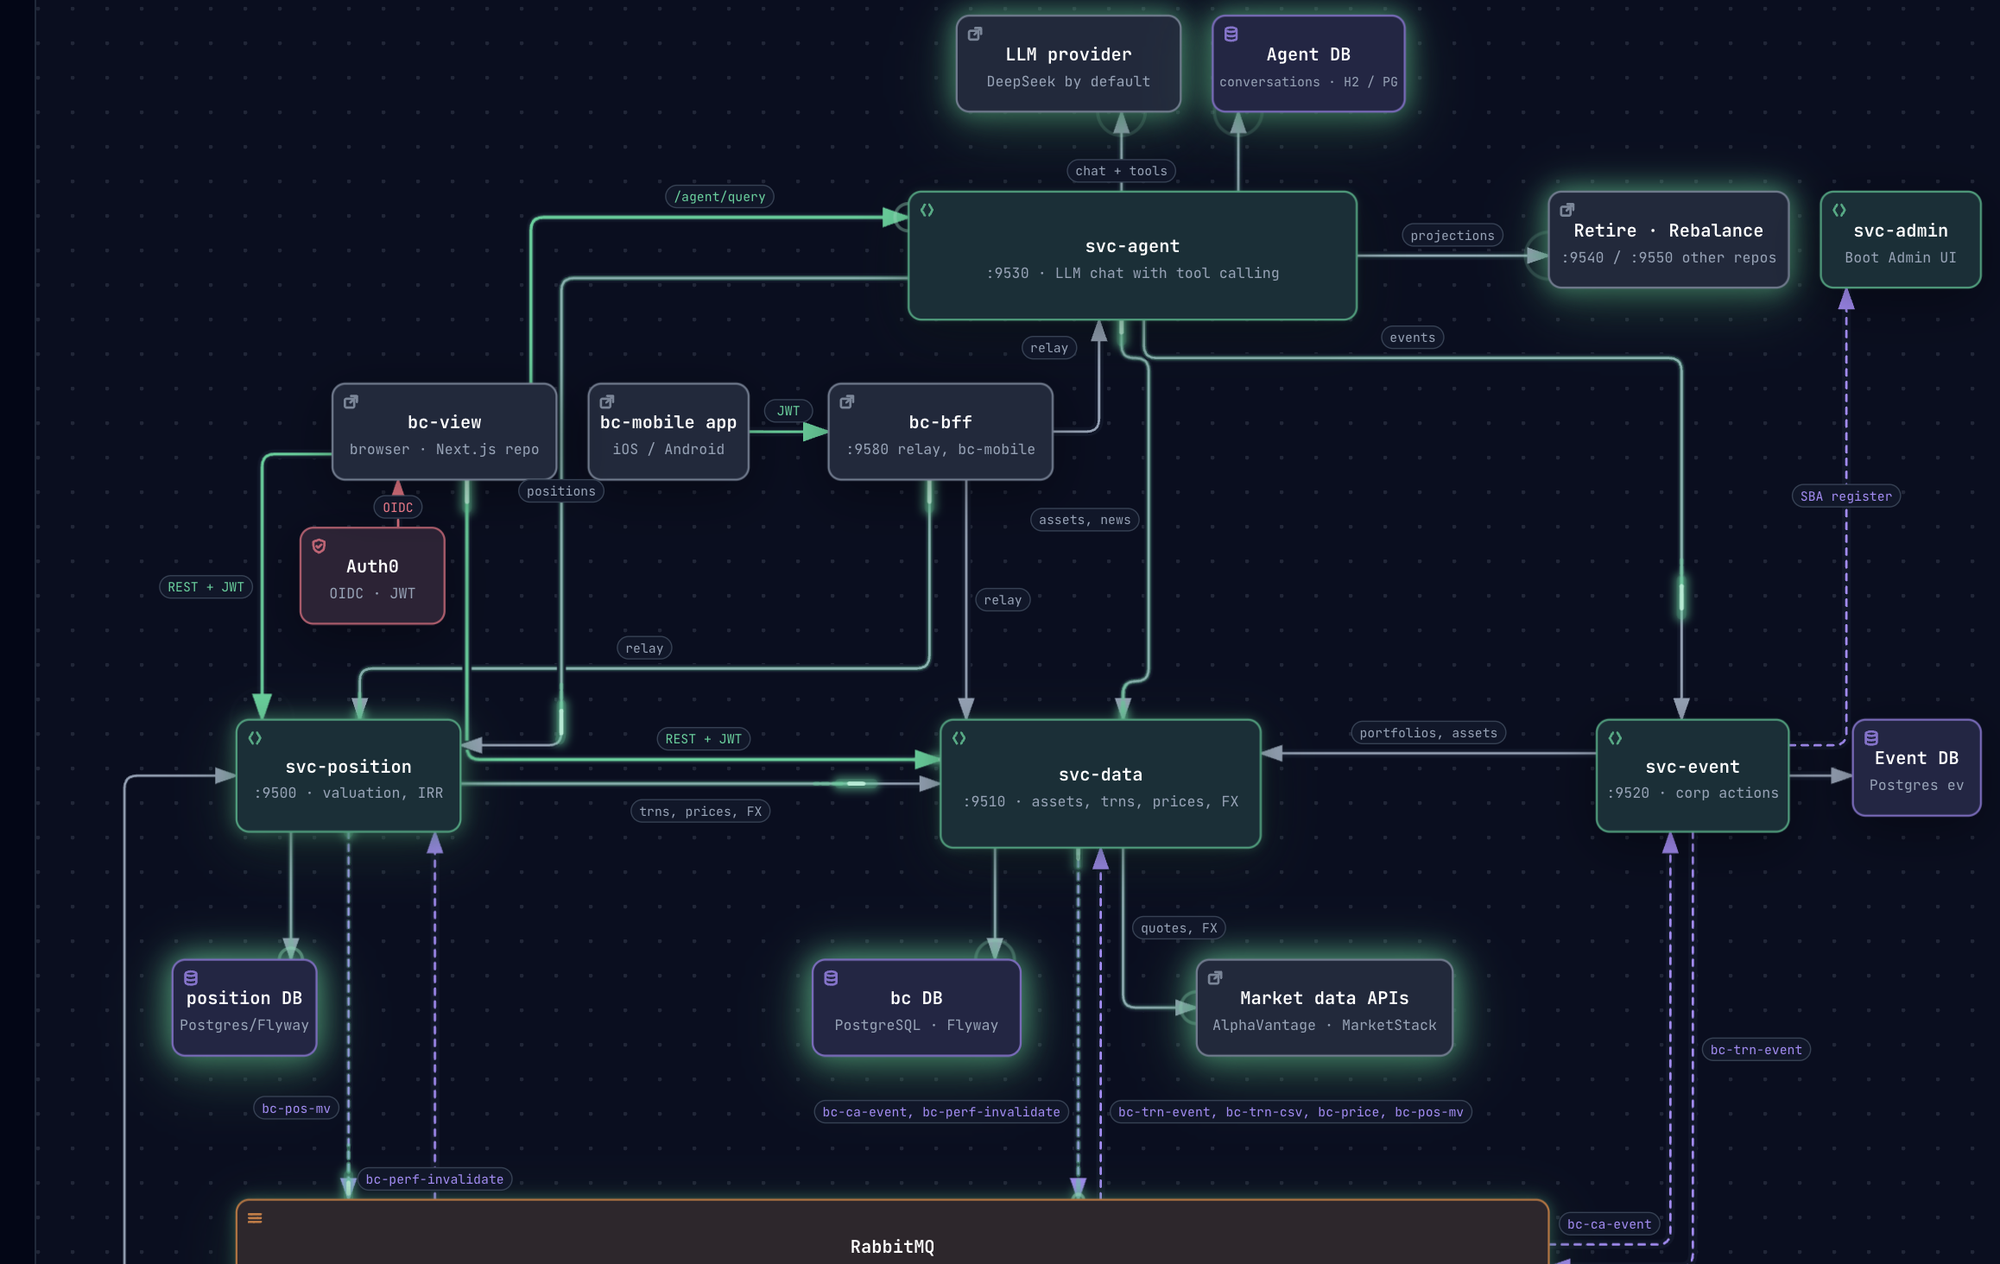
As an overview this is useful. It is the picture I would draw on a whiteboard for someone joining the project, and it took a minute rather than a morning. It has gaps of its own. Only bc-view is shown connecting to Auth0. In reality bc-mobile connects to it too, and so do the services, for token verification and for machine-to-machine authorisation between them. The one edge it drew is the one a reader would guess; the ones it left out are the ones that explain how the system actually trusts a request.
Then I asked for an overview of how an authorised HTTPS request is processed through the code. I did not ask for a sequence diagram. It decided that was the right answer to that question and produced one, without having to be prompted.
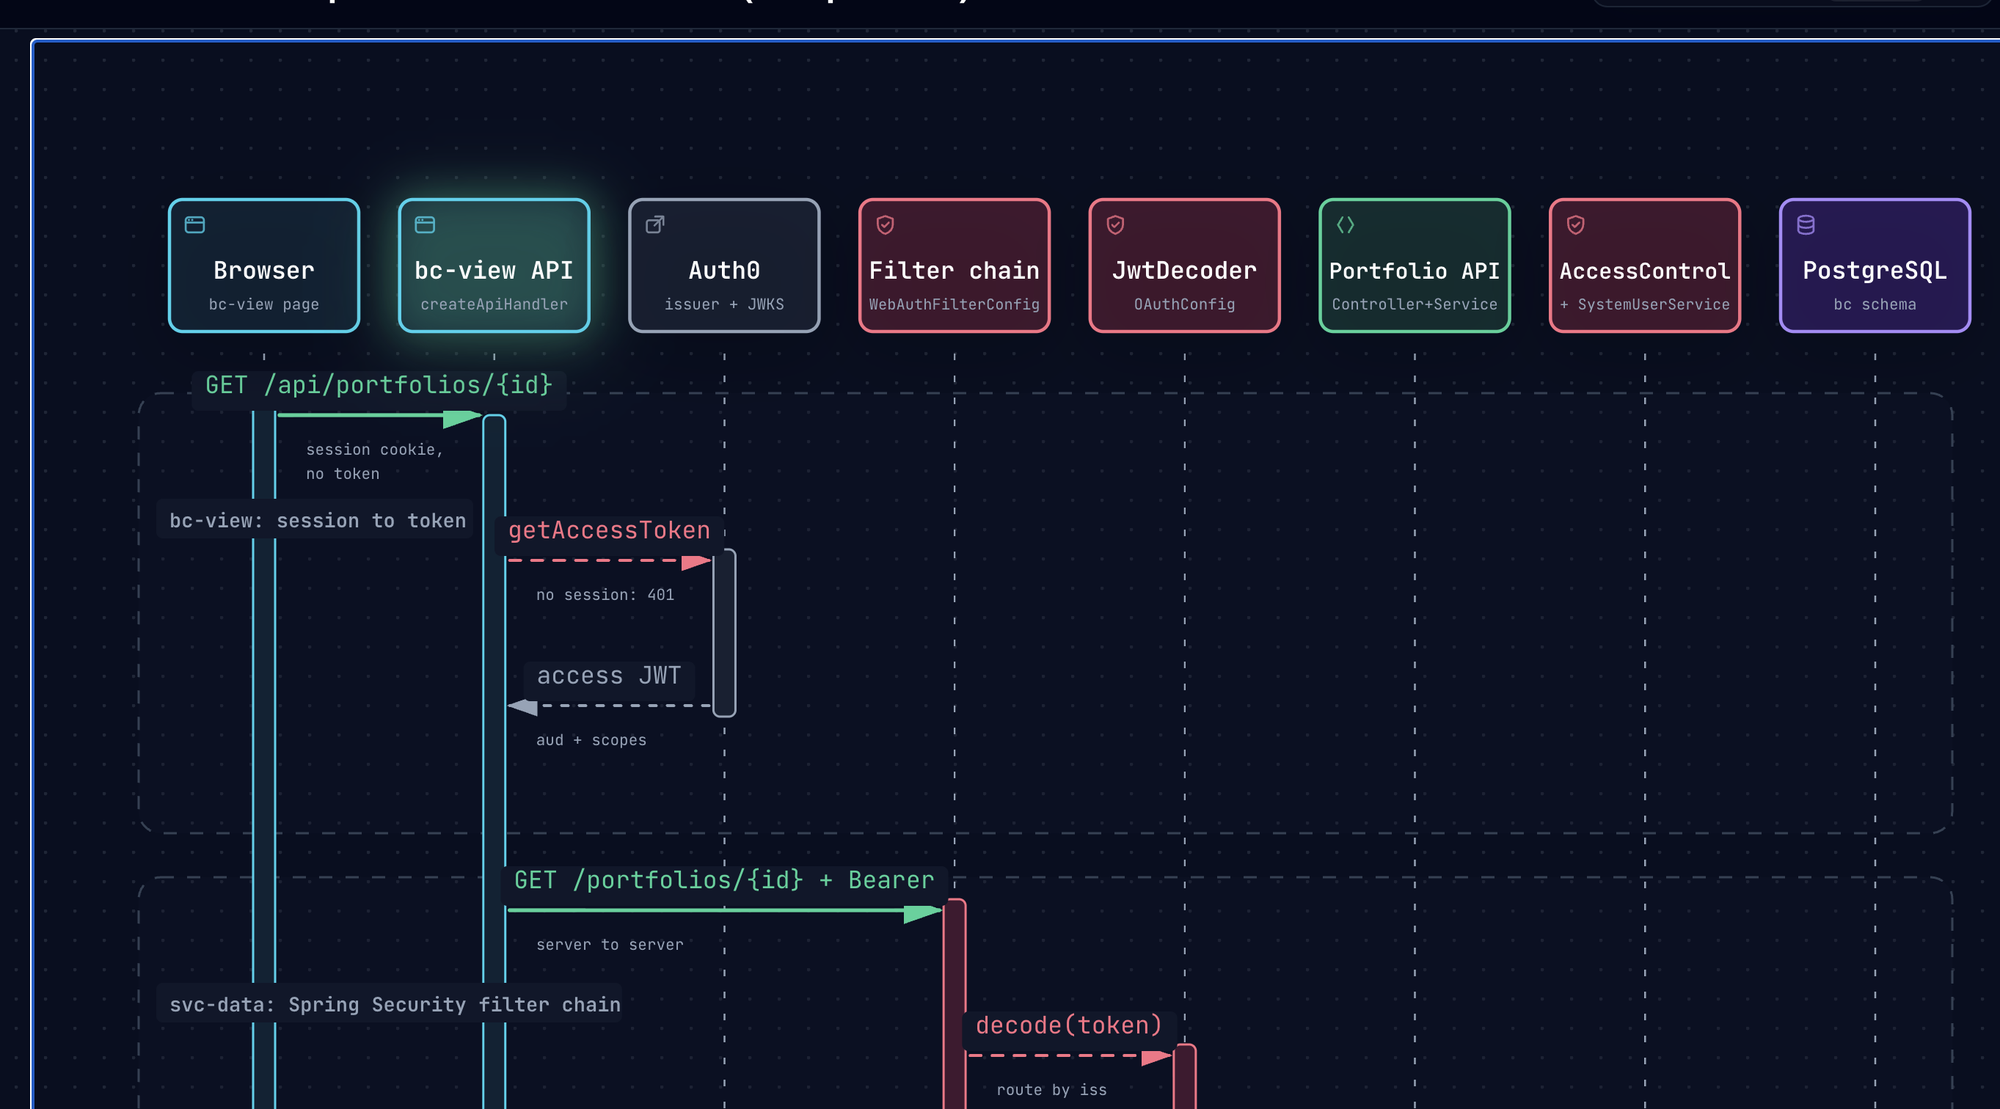
That is the result that made me sit up. The choice of diagram was the choice I would have made. The lanes are not quite right, though. It shows the PortfolioController, and on first reading I took the PortfolioService and the PortfolioDAO, the classes that actually interact with Postgres, to be missing. They are not quite missing. A note beside the diagram says so: the controller and the PortfolioService share one lane, as do the access control and the system user service, because nine separate lanes did not fit a readable width. A reasonable call, and an honest one. But the picture itself does not say it, and it is the PortfolioService that decides whether the caller is allowed to see the requested portfolio. The class that answers the question I asked is folded into another one's lane, and you only find out by reading the caption. The DAO is still absent. Arguably defensible, since I asked about authorisation, not persistence. But then why draw the database at all?
Where it fits
Three diagrams, three gaps, and the same gap each time: the edge or the class that decides whether a request is trusted is the one left out, or folded into something else. That is not a coincidence. The documentation and the code name the happy path loudly and the control path once, and a tool that reads for structure draws what is said most often. To its credit, the tool wrote down what it merged. The lesson is to read the notes as carefully as the picture, because the picture is the part that gets pasted into the slide.
You can ask it to go back and correct each of those. It will, and it costs tokens every time, which is the other half of the argument for knowing the subject before you ask.
A promising tool, with the same caveat as the rest of the category. The quality of the picture is bounded by the quality of what it reads, and the gaps it leaves are the gaps in the documentation and in the structure, surfaced in a form that is easy to look at and easy to trust too early. Treat it as a reviewer, not an author. Where the diagram is right it saves you the drawing. Where it is gappy, the gap is a finding about the repo, and the fix belongs in the Markdown, not in the picture. That is the real change. In the old days we updated the diagram while the source material drifted away on its own journey. Now the diagram is disposable and the specification is the thing you maintain, which is the right way round.
The diagram is only as finished as the documentation it was drawn from. That is not a limitation of the tool. It is the case for spec-driven development: write the specification first, and the picture, the code and the agent all read from the same source.